
This analysis of the 2018-19 DC theater season covers playwright and director demographics and the production status of the plays that were programmed. Completed in collaboration with DC-based theater artist Olivia Haller, the analysis covers plays that opened (or will open) between September 1, 2018 and August 31, 2019. The results below represent the final calculation for the entire season. The data set includes 210 productions at 63 theaters, all of which are listed below.
Note: this year’s analysis has been supported by theatreWashington.
Playwright Demographics: Gender
Of the plays slated to be produced in DC during the 2018-19 season, 69.75% were written by men, 28.32% by women, and 1.93% by authors who do not use binary gender identities. This represents a significant decrease in gender parity from the previous season. The percentage of non-binary authors, however, has increased. For the sake of comparison, here are the current season’s numbers alongside those from the previous six seasons:
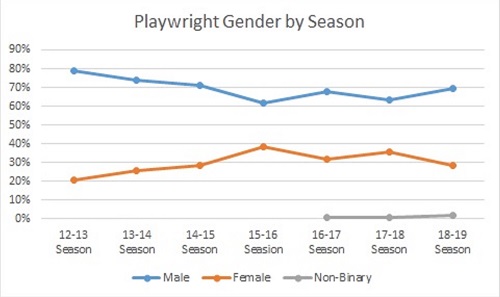
— The inaugural Women’s Voices Theatre Festival was held during the 15-16 season;
the second Women’s Voices Theatre Festival was held during the 17-18 season.
— In a regrettable omission, data on playwrights with non-binary gender identities
were not tracked prior to the 2016-17 season.
Of further interest are the distinct gender analyses of Equity and non-Equity theaters:
- Equity: 69.15% men, 29.92% women, .94% writers with non-binary gender identities
- Non-Equity: 70.39% men, 26.63% women, 2.97% writers with non-binary gender identities
There are also three new and significant findings from the current season:
- When considering only plays by living writers, gender party numbers are moderately better: 64.53% men, 33.64% women, and 1.83% writers with non-binary gender identities.
- When considering only new plays, gender party numbers are even better: 60.21% men, 34.95% women, and 4.84% writers with non-binary gender identities.
- When considering only new plays produced by Equity theaters, gender party numbers are even better still: 54.93% men, 41.36% women, and 3.71% writers with non-binary gender identities.
Playwright Demographics: Diversity
The breakdown of the playwrights whose plays are slated to be produced in DC during the 2018-19 season is as follows: 79.16% are white and 20.84% are people of color. Overall, this represents a slight decrease in diversity from the previous season, though the trend over the last seven seasons seems to be upward:
Of further interest is the fact that diversity is roughly equivalent between Equity theaters and non-Equity theaters:
- Equity: 21.14% playwrights of color
- Non-Equity: 20.21% playwrights of color
There are also three new and significant findings from the current season:
- When considering only plays by living writers, diversity numbers are moderately better: 25% playwrights of color.
- When considering only new plays, diversity numbers are considerably better: 33.47% playwrights of color.
- When considering only new plays produced by Equity theaters, diversity numbers are even better still: 44.07% playwrights of color. For comparison’s sake:
- Current estimates suggest that people of color in the United States comprise a smaller percentage of the population: 38.7%.
- In the DC metropolitan area, however, one estimate puts the number higher: 54.2%.
Playwright Demographics: Geography
Finally, of the playwrights whose plays are being produced in DC in the 2018-19 season, 19.39% are residents of the DC metropolitan area, which represents a record high. In 2017-18, the number was 18.28%; in 2016-17, the number was only 8.70%; in 2015-16, the number was 17%; in 2014-15, the number was 16%; in 2013-14, the number was 13%; and in 2012-13, the number was 16%.
Of the plays by living writers, 22.53% were written by residents of the DC metropolitan area. Of the new plays, 51.89% were written by residents of the DC metropolitan area. Of the new plays produced by non-Equity theaters, 71.43% were written by residents of the DC metropolitan area.
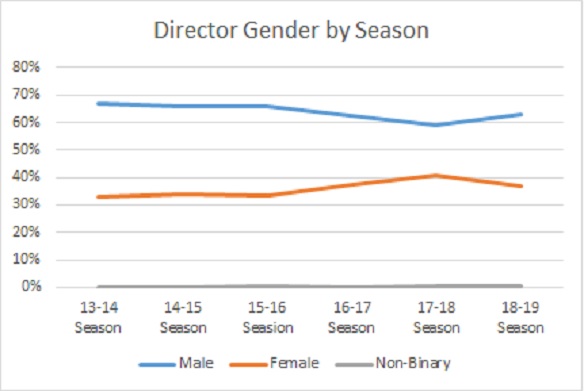
Director Demographics: Gender
Of the plays being produced in DC during the 2018-19 season, 62.75% are being directed by men, 36.76% by women, and .49% by artists who do not use binary gender identities. These numbers represent a decrease in gender parity over the previous season and, perhaps, the reversal of a five-season trend as well:
Of further interest is the fact that gender parity is significantly greater among non-Equity theaters than among Equity theaters:
- Equity: 71.36% men, 28.64% women, 0% artists with non-binary gender identities
- Non-Equity: 53.96% men, 45.05% women, 0.99% artists with non-binary gender identities
To emphasize this finding even further: among non-Equity theaters, director assignments are approaching gender parity for the second year in a row.
There are also three new and significant findings from the current season:
- When considering only productions of plays by living writers, gender party numbers are only slightly better: 61.04% men, 38.34% women, and .61% artists with non-binary gender identities.
- When considering only productions of new plays, gender party numbers are even better: 56.15% men, 42.31% women, and 1.54% artists with non-binary gender identities.
- When considering only productions of new plays by non-Equity theaters, DC has exceeded gender parity: 47.30% men, 50% women, and 2.70% artists with non-binary gender identities.
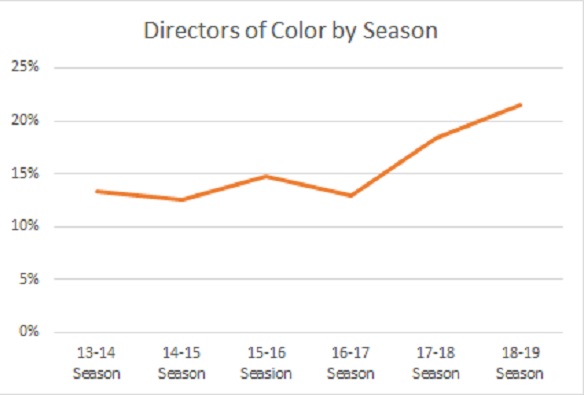
Director Demographics: Diversity
The breakdown of the directors in the 2018-19 season is as follows: 78.48% are white and 21.52% are people of color. These numbers represent a continued increase in diversity among directors:
Of further interest is the fact that diversity is moderately greater among Equity theaters than among non- Equity theaters:
- Equity: 25% directors of color
- Non-Equity: 18.07% directors of color
There are also three new and significant findings from the current season:
- When considering only productions of plays by living writers, diversity numbers are only slightly better: 24.22% artists of color.
- When considering only productions of new plays, diversity numbers are even better: 28.91% artists of color.
- When considering only productions of new plays by Equity theaters, diversity numbers are better still: 33.33% artists of color.
Director Demographics: Geography
Finally, of the directors included in the 2018-19 season, 67.33% are residents of the DC metropolitan area. In the 2017-18 season, that number was 75.24%; in the 2016-17 season, that number was 69.89%; in the 2015-16 season, the number was 66.58%; in the 2014-15 season, the number was 71.98%; and in the 2013-14 season, the number was 75.04%. These numbers suggest only modest fluctuation across the previous five years. Also worth noting: Equity theaters hire significantly fewer local directors (54.37%) than non-Equity theaters (95.71%).
Production Data
Of the plays being produced in DC in the 2018-19 season: 25.84% will be having their world premieres; 5.26% will be having their second or third productions; and of the remaining plays, 49.72% were written by living playwrights and 19.18% by dead playwrights.
Another way to consider the same data points: in the 2018-19 season, 31.10% of the plays appearing on DC stages are new, if we define “new†plays as those receiving their first, second, or third productions. (This is, very roughly speaking, the widely-accepted definition used by the National New Play Network.) In the 2017-18 season, that number was 33.34%; in the 2016-17 season, that number was 27.47%; in the 2015-16 season, that number was 42.85%; in the 2014-15 season, that number was 32.56%; and in the 2013-14 season, that number was 30.20%.
At the same time, a full 80.82% of the plays being produced in the 2018-19 season were written by living playwrights. In the 2017-18 season, that number was 79.31%; in the 2016-17 season, that number was 82.91%; in the 2015-16 season, that number was 86.24%; in the 2014-15 season, that number was 77.87%; and in the 2013-14 season, that number was 77.48%.
Generally speaking, these percentages have remained consistent over the six years of this study.
Of further interest: non-Equity theaters (31.37%) are significantly more likely to produce world premieres than Equity theaters (20.56%).
* The theaters in this analysis include: 4615 Theatre Company, 1st Stage, Adventure, Alliance for New Musical Theatre, Ally, Anacostia Playhouse, Annapolis Shakespeare, Arena, Arts on the Horizon, Best Medicine, Brave Sprits, Compass Rose, Constellation, Convergence, Creative Cauldron, Faction of Fools, Flying V, Folger, Ford’s, Gala Hispanic, Happenstance, Hub, Imagination Stage, Interact Story Theatre, Keegan, Kennedy Center, The Klunch, Landless, Longacre Lea, Metro Stage, Monumental, Mosaic, National, Nelwat Ishkamewe, Next Stop, Nu Sass, Olney, Pinky Swear, Pointless, Prologue, Quotidian, Rainbow, Rep Stage, Rorschach, Roundhouse, Scena, Shakespeare, Signature, Solas Nua, Spooky Action, Studio, Synetic, Taffety Punk, Theater Alliance, Theater J, Theatre Prometheus, Toby’s Dinner Theatre, Unexpected Stage, Washington Stage Guild, We Happy Few, Welders, Woolly Mammoth, and WSC Avant Bard.
You must be logged in to post a comment.